


🆕 Inside Safe AUDIT
Nearly 5,000 people enrolled in Mayor Bass’s shelter program in its first two years, and two-thirds remain indoors.

I’m
and I live outside in Los Angeles.This article follows-up on one I wrote in October 2023:

🔗 All data is linked at the end of the article, so you can check it out and draw your own conclusions! Please let me know what you think in a comment.

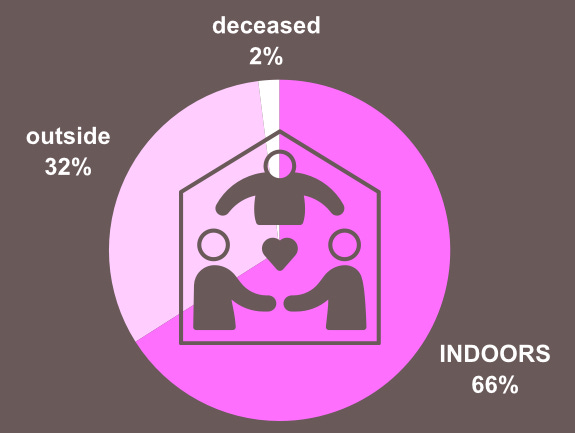
66% of people who enrolled in Inside Safe are indoors.
4,994 Participant Statuses:
3,305 indoors
1,606 outside
83 deceased
Nearly 5,000 people enrolled in Inside Safe by New Years’ Eve and an additional 346 people enrolled in January. As of January 31, 5,340 participants have enrolled in the Inside Safe program “ISP”.
21%* 12% of Inside Safe participants moved into permanent housing.
As of the end of last year, 609 people had moved from Inside Safe to permanent housing “PH”:
288 people are on subsidies like Section 8 housing choice vouchers “HCVs”,
283 moved to permanent supportive housing “PSH” units, like those built and financed through the City’s Measure HHH, as they become available. PSH units are subsidized by Project-Based vouchers “PHVs”.
38 people got market-rate “MR” (unsubsidized) housing. It’s unclear if the Inside Safe program “ISP” assisted these participants in securing private leases.
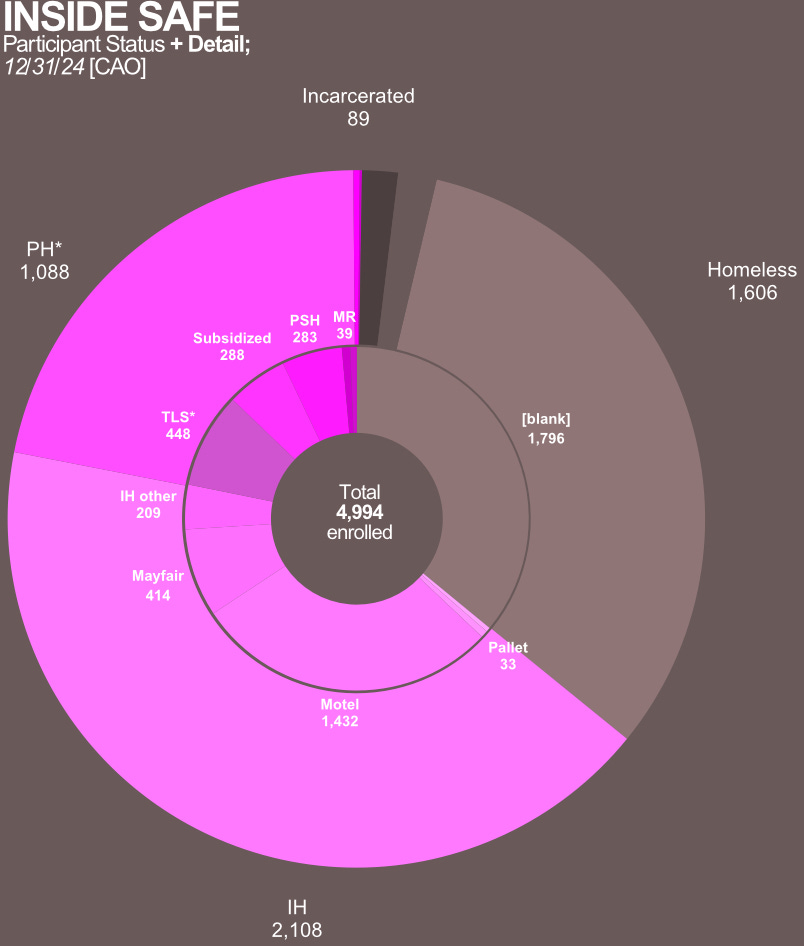
In addition to the 12% who are permanently housed, 54% of Inside Safe participants are sheltered.
2,552 participants enrolled in ISP are in interim housing “IH”/shelter.
1,846 Inside Safe participants are in hotels and motels (37%):
1,432 people are staying in motels that have booking or occupancy agreements with the City.
414 participants are in The Mayfair Hotel, a City acquisition in Eunisses Hernandez’ District 1

448 people are housed with Time-Limited Subsidies “TLS”*, which are also called Rapid Re-Housing “RRH” (9%). *TLS typical duration = two years. I’m uncomfortable calling this subpopulation “permanently housed” like the City does. In 2013, the U.S. Housing and Urban Development Department “HUD” re-classified people on this kind of subsidy as “housed”, which made homeless counts appear to improve. Unfortunately, many households on TLS end up homeless again, like 300 families Byrhonda Lyons and Jeanne Kuang reported on in Calmatters a year and a half ago.
204 people are in Interim Housing “IH” - “other IH” (4%). There is no explanation on what this housing is. Maybe it is “halfway” housing by the Office of Diversion and Re-entry “ODR”, SHARE! nonprofit, market-rate housing, or something else?
Additional “sheltered” statuses:
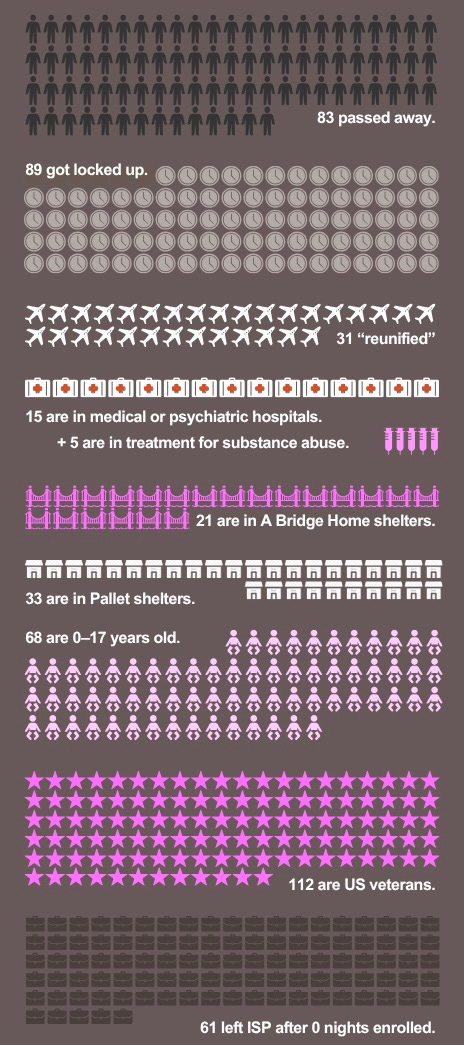
194 participants had other outcomes (4%) but many of them still probably need housing:
89 people are incarcerated,
31 people accepted transportation out of LA through “reunification” programs
15 people are in medical or psychiatric hospitals, and
5 people are in substance abuse treatment facilities,
21 people are in A Bridge Home “ABH” congregate shelters,
33 people are in “villages” of Pallet Shelter tiny structures.
32% of enrollees are on the street, with one-third in touch with providers.
1,714 out 5,320 participants “returned to homelessness”
586 remain in touch with service providers
61 people enrolled for zero days (1%).
I wrote more about serious issues in Inside Safe here:

Total enrollments +494% in 22 months.
March 2023 • 1,077
January 2025 • 5,320
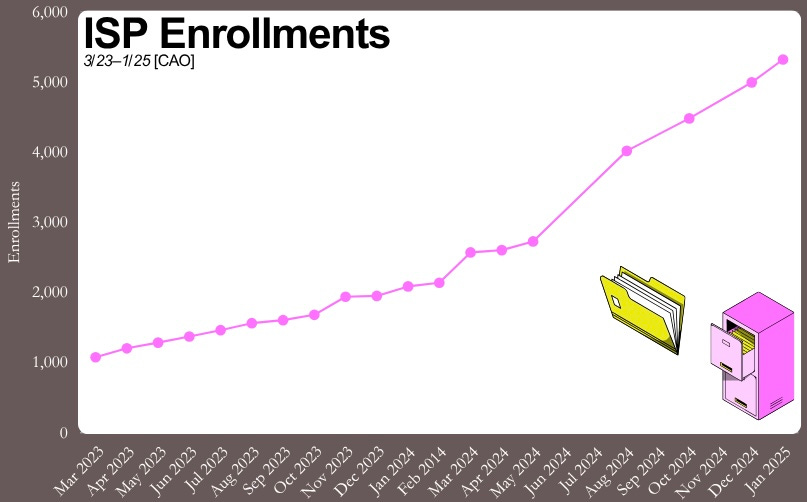
Enrollments have been tightly controlled to stay within budget constraints while focusing on highly-visible “encampments”. One of the top issues I encounter is qualified unhoused people who want to access ISP, but can’t. The bottleneck in “throughout” is lack of available housing and subsidies for permanently exiting participants.
I am not enrolled in Inside Safe. My neighborhood was targeted for an Inside Safe operation last year, but it got cancelled. I wrote about it here:

49% of participants have documents; await housing placements.
2,441 Document-ready (Avg. 411 days)
2,553 Not yet documented (Avg. 136 days)
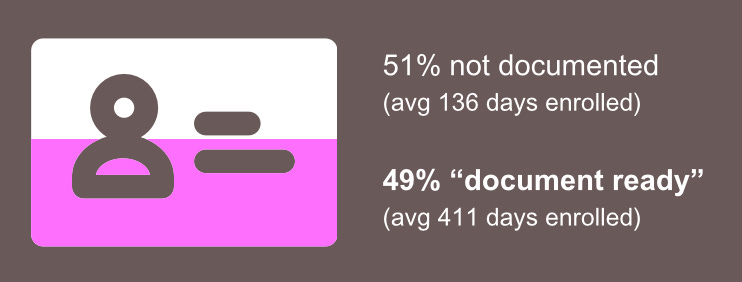
The longer people stay enrolled, naturally, the more get their documents and they are less likely lose them.
Participants spent 1,767,138 nights enrolled in Inside Safe in the first two years.
Average enrollment: 355 nights (≈ 1 year)
According to the data I obtained from the City Administrative Officer “CAO” Matt Szabo, 16 participants have been in Inside Safe for over two years continuously, which isn’t a great sign that housing placements are moving along expeditiously.
But the fact remains: the program has retained them, as Mayor Bass promised. In Project Roomkey, hotels were constantly being “demobilized” to switch service providers, removing participants, and cause staff to have to seek unemployment. Inside Safe seems to be a more stable environment.
83 people are known to have passed away (2%).
🕯
0.8% Annualized Program Mortality
83 Inside Safe participants were known to have perished as of the end of 2024 (1.7%). That means the mortality rate of the first two years of Inside Safe is 1,662 per 100k. In 2023, the annualized mortality rate of people experiencing homelessness “PEH” in Los Angeles County was 3,326 per 100k, using figures from the Department of Public Health “DPH” and Los Angeles Homeless Services Authority “LAHSA”’s point-in-time “PIT” count. Inside Safe seems to significantly improve mortality, slashing rates for participants to levels closer to that of the general housed population.

Disappearing Dwellings
3,465 tents in 2020
2,589 tents in 2025* *draft
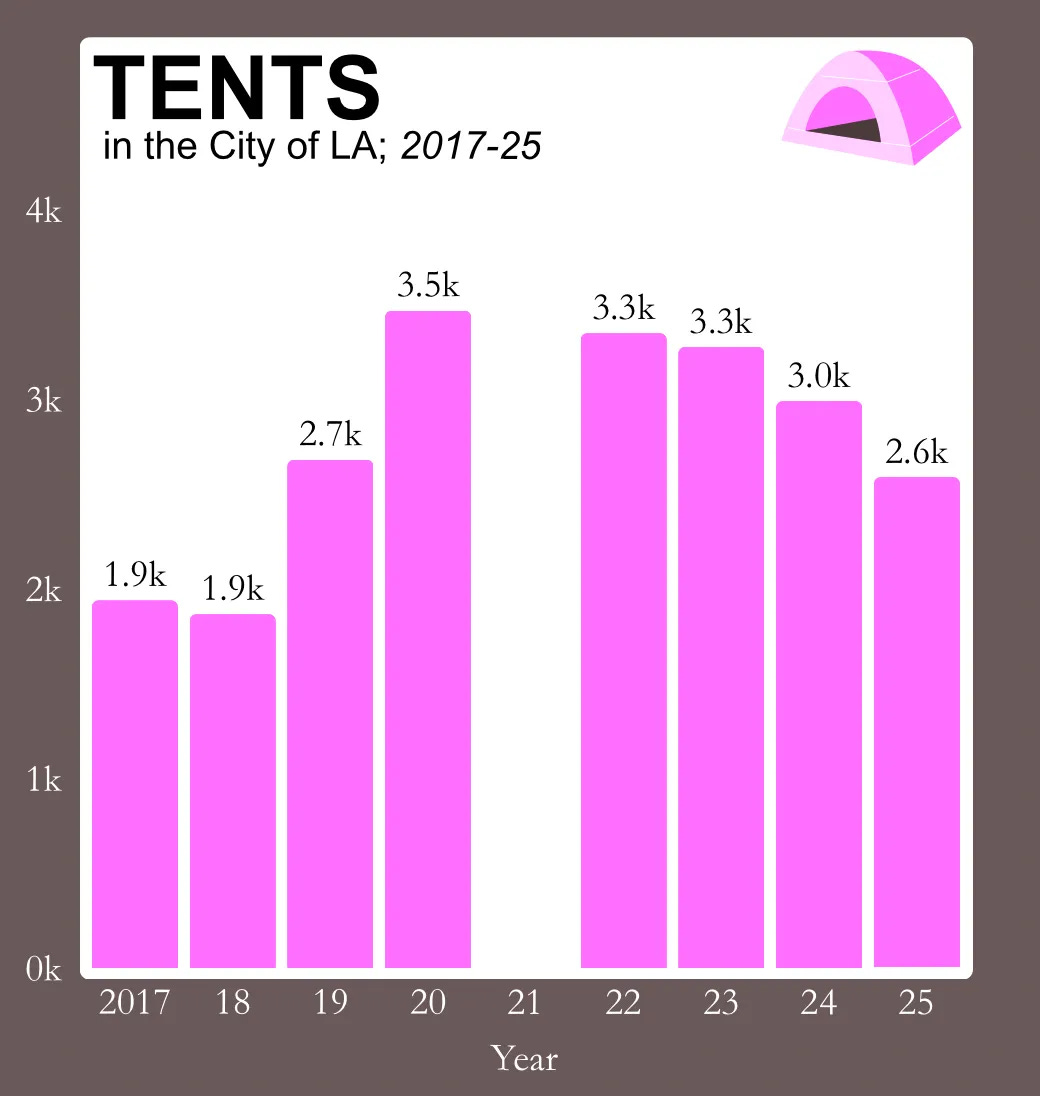
After reaching an all-time high of 3,465 tents in 2020 (this was technically a pre-pandemic count because it was in January), the number of tent-dwellings has been slowly but surely decreasing. The draft 2025 count, obtained from LAHSA through CPRA, indicates fewer than 2,600 tents City-wide, coming directly from tally sheets collected by point-in-time “PIT” volunteers. It is unclear if or when it will be publicly released. Meanwhile, other homeless populations, like people in emergency shelters, are on the rise.
I wrote about LAHSA’s choice to withhold 2023’s dwellings counts here:

I don’t celebrate reductions in makeshift shelters because, to me, tents represent survival and independence. 1,846 people are in Inside Safe motels and The Mayfair, with most having given up their survival supplies to redeem that opportunity, and their continued status indoors probably depends a lot on the Mayor getting re-elected.
Outside Safe?
Homeless victims of homicide:
2022: 92 (per LAPD data via my CPRA).
2023: 56 (per LAPD Homicide Report).
2024: 8* (using MO code 1218) *preliminary from open data; not complete
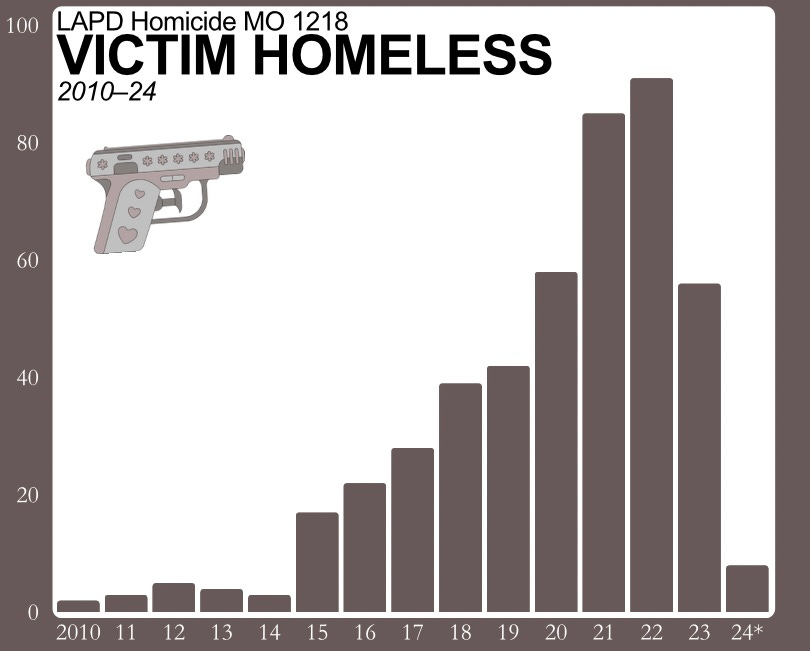
A sustained reduction in homicides with homeless victims is cause for applause. My 2024 data isn’t complete, but the difference of 36 fewer homicides in 2023 compared to 2022 is confirmed and significant. Inside Safe participants are technically still homeless until permanently housed, but their sheltered status likely contributes to safer conditions.
I wrote about 2022’s 92 homicides with unhorsed victims here:


In November 2022, voters in the City of LA saw Karen Bass as the leader equipped to address the top issue of homelessness over her well-connected, wealthy competitor, Rick Caruso, who had the endorsement of the LA Police Protective League “LAPPL”, on which he is a commissioner. Maybe this achievement is what earned Mayor Karen Bass an endorsement from the police for her re-election, over Los Angeles Police Protective League Commissioner-challenger Rick Caruso.
Considering Bass’s considerable achievements in public safety and shelter, it makes sense for Caruso’s own co-commissioners to endorse the incumbent mayor so early. But gaining the support of LAPPL is not the same as keeping the favor of the voting majority. What more would people like to see from the Mayor and her Inside Safe program before they feel confident re-electing her?
What can you do?
Ask your council person what is delaying the opening of Homekey acquisitions
Introduce your neighborhood council to residents and staff at City-run shelters
Demonstrate around vacant housing units to demand immediate occupancy
Identify affordable rentals to facilitate “throughput” of shelter participants
Raw ISP participant status data:
Click here for January 2025 PDF
Click here for December 2024 data
Click here for October 2024 PDF
Click here for August 2024 PDF
Click here for March 2024 data
Click here for September 2023 data
Obtained through California Public Records Act “CPRA”/Freedom Of Information Act “FOIA” requests on the City of Los Angeles’ NextRequest portal, lacity.nextrequest.com.
The data I analyzed for this article is from December 31, 2024 because the 2025 data is a PDF. I’m certain an AI is capable of converting it into a usable format such as .CSV, but I have not found a free one that is up for the job. Please let me know if you have the solution (besides for tailoring multiple different requests to the City, which is what eventually worked).
Wombo dream.ai (illustrations) • Canva (graphics) • Flourish Studio (map)
This is so insightful and important. Thank you for your service to the community!